Resources
Mar 11, 2025
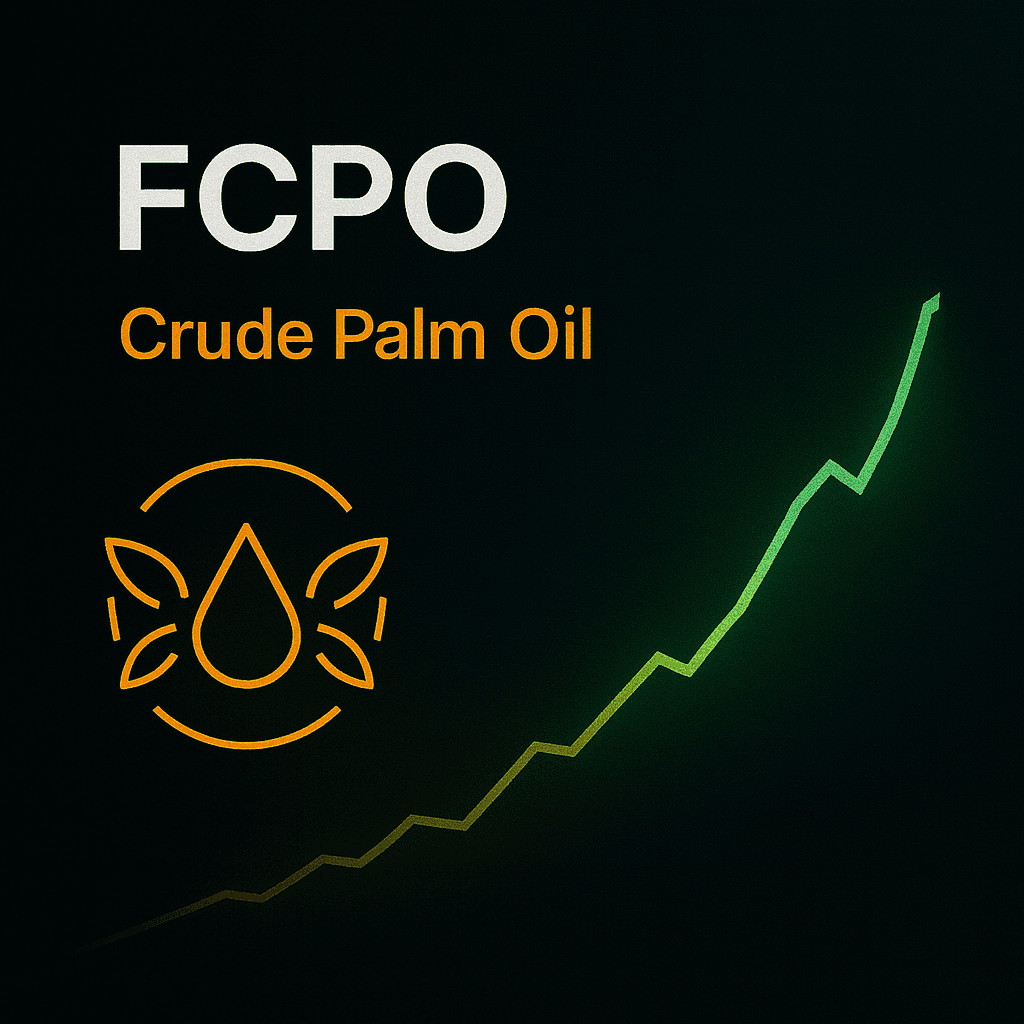
FCPO Product Performance
Explore the 2025 year-to-date performance of our top-performing products. Click to view monthly breakdowns, equity curves, and statistics.
Introduction
Explore how our rule-based strategies are performing across different portfolios.
Data Preview
Below is are the recent performance of the strategies for the year 2025. (as of Aug 2025)
Strategies
Win Rate
Gross Profit (%)
Drawdowns (%)
S1 (Breakout + Volatility Filter)
68.24%
90.9%
19.4%
S2 (Trend + Breakout)
64.84%
134.2%
23.4%
S3 (Trend + Volatility Filter)
44.37%
55.9%
40.3%
S4 (Trend + Momentum Strength)
74.42%
98.3%
18.6%
Note: Figures are based on simulated live trades and backtested models. Annual performance values represent results for the period January 1 through December 31, and are calculated using standard margin requirements with recommended buffers. Minimum capital requirements may vary depending on the product traded, broker margin policies, and individual risk preferences.
To view more detail regarding the performance, please click the link here.
Disclaimer
Past performance does not guarantee future results. Trading in futures and commodities involves substantial risk, including the potential loss of principal. Market conditions, volatility, and macroeconomic factors can significantly affect performance over time. Investors should conduct their own due diligence and consider seeking independent financial advice when necessary.